Iona writes: To explore the contents of EEBO-TCP in a distant fashion (and give context to Linguistic DNA data), I have continued to experiment with the Text Creation Partnership’s metadata. Some of this work has been documented in conference papers presented at SHARP and DRHA. Having spent time examining the metadata for items (said to have been) printed in the 1550s and in the years 1610 and 1611 (to be documented in a subsequent blog post), I have now moved on to experiment with how categories observed in those slices manifest across the broader dataset.
One prominent category provided by the TCP Terms listings (a part of the TCP metadata that derives from the same source as much of the ESTC, and is in debt to prior cataloguing efforts) is “Controversial Literature”. About 5.5% of EEBO items in the GitHub TCP catalogue carry this label. Using time as a primary dimension (being the simplest metadata entity to map), it is possible to see how the distribution of “Controversial Literature” in the 1550s compares with other decades.
The following chart plots the raw quantity of EEBO-TCP items labelled “Controversial Literature” in each decade:
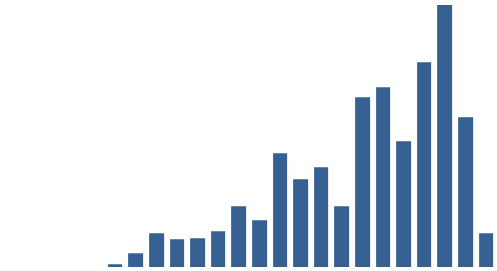
“Controversial Literature”: raw number of items in TCP by decade
For the first half-century of EEBO-TCP (1470-1519), no items carry the label. This is not entirely surprising: The quantity of surviving print items transcribed for this early period is much slighter. The next chart plots the raw quantity of all items in EEBO-TCP by decade as an aid to comparison:
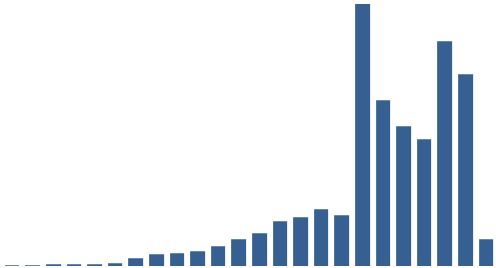
All EEBO-TCP: items plotted by decade of printing.
The sparsity of the early period is visible. The drop in the final column (representing the decade beginning 1700) in both charts is a by-product of decade apportionment given the criteria that define EEBO: 817 items carry the date 1700, very few post-date that. Looking at the second chart, the quantity of items printed grows steadily until the 1630s (a slight dip). From the 1640s, the trend breaks down as overall quantities increase significantly: more than 76% of EEBO-TCP items post-date 1640.
It is possible to gain some insight by comparing these two charts. For example, a dip in the 1630s is common to both TCP-whole and Controversial-part. We are not limited to the raw perspective: The Controversial values can be normalised by the total number of EEBO-TCP items from the given decade (dividing raw counts), to show how the share of Controversial literature (v. Items not-labelled-Controversial Literature) varies by decade.
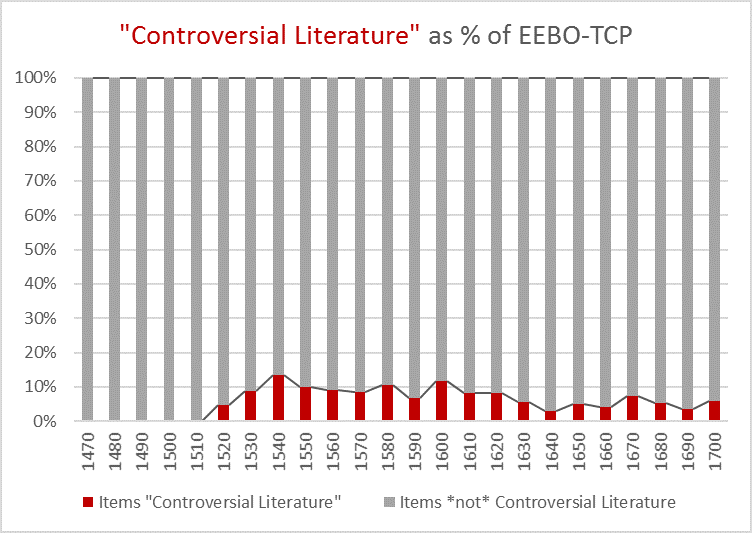
Each bar represents 100% of EEBO-TCP items for the given decade
This mode of representation may make Controversial Literature seem like a marginal category when compared with the mass of other items. Yet in four decades (1540s, 1550s, 1580s and 1600s) this category makes at least 10 per cent or more of the total. If we retain the normalisation but view the information (i.e. percentage of EEBO-TCP items labelled as Controversial Literature by decade) in the plain chart format, the earlier perception of growth is effectively challenged:
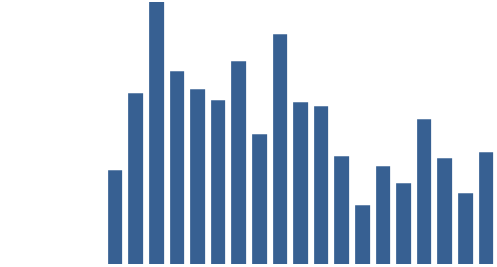
On the wane: “Controversial Literature” as percentage of EEBO-TCP by decade.
From the high point of the 1540s, the market share of “Controversial Literature” appears to decline (if we allow ourselves to conceive of TCP as a market).
Of course, decades are an imposition. This is made evident when we consider the two-year period 1610 to 1611. The following chart counts EEBO-TCP items across 2-year periods, with a trendline tracking the moving average across 5 such periods (i.e. spanning a ten-year period).
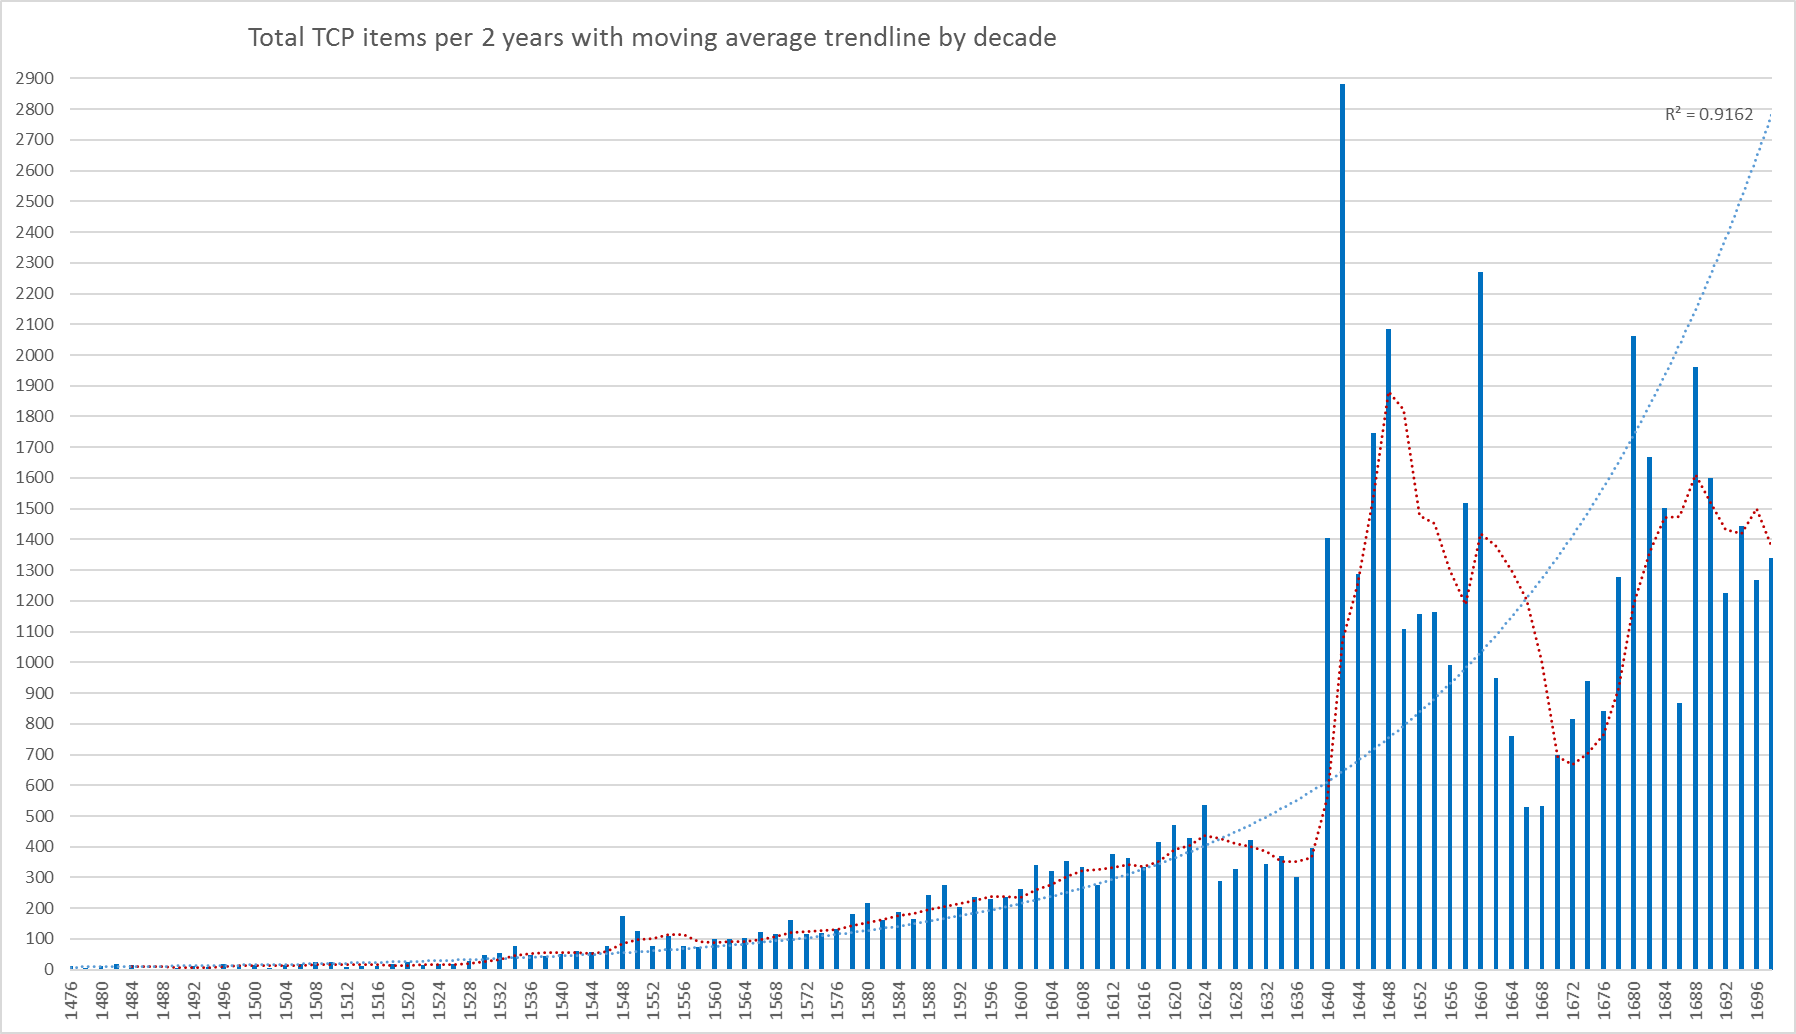
“Controversial Literature”: Raw counts of items in two-year periods, with decade moving average.
The overall pattern remains one of exponential growth (a fitted curve reaches R-squared value of .916). For the two-year period beginning 1610, the item count is visibly below the relevant average, and slightly shy of the growth curve.
Here’s a snapshot from the relevant data:
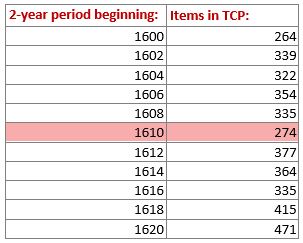
Total quantity of EEBO-TCP items for specified 2-year period(s).
The next chart plots “Controversial Literature” data in the same way, albeit omitting the periods from 1522 to 1527 (because their zero values prevent exponential curve plotting). Here, the period 1610-1611 stands proud of the growth curve, matching closely the moving average. Considered in terms of the (raw) quantity of “Controversial Literature”, this period has more in common with the 4 preceding ones (1602-1609) than those that follow.

“Controversial Literature” items by 2-year period, with decade moving average and trendline.
This is the equivalent snapshot from the raw data:

Total quantity of “Controversial Literature” items for specified 2-year period(s).
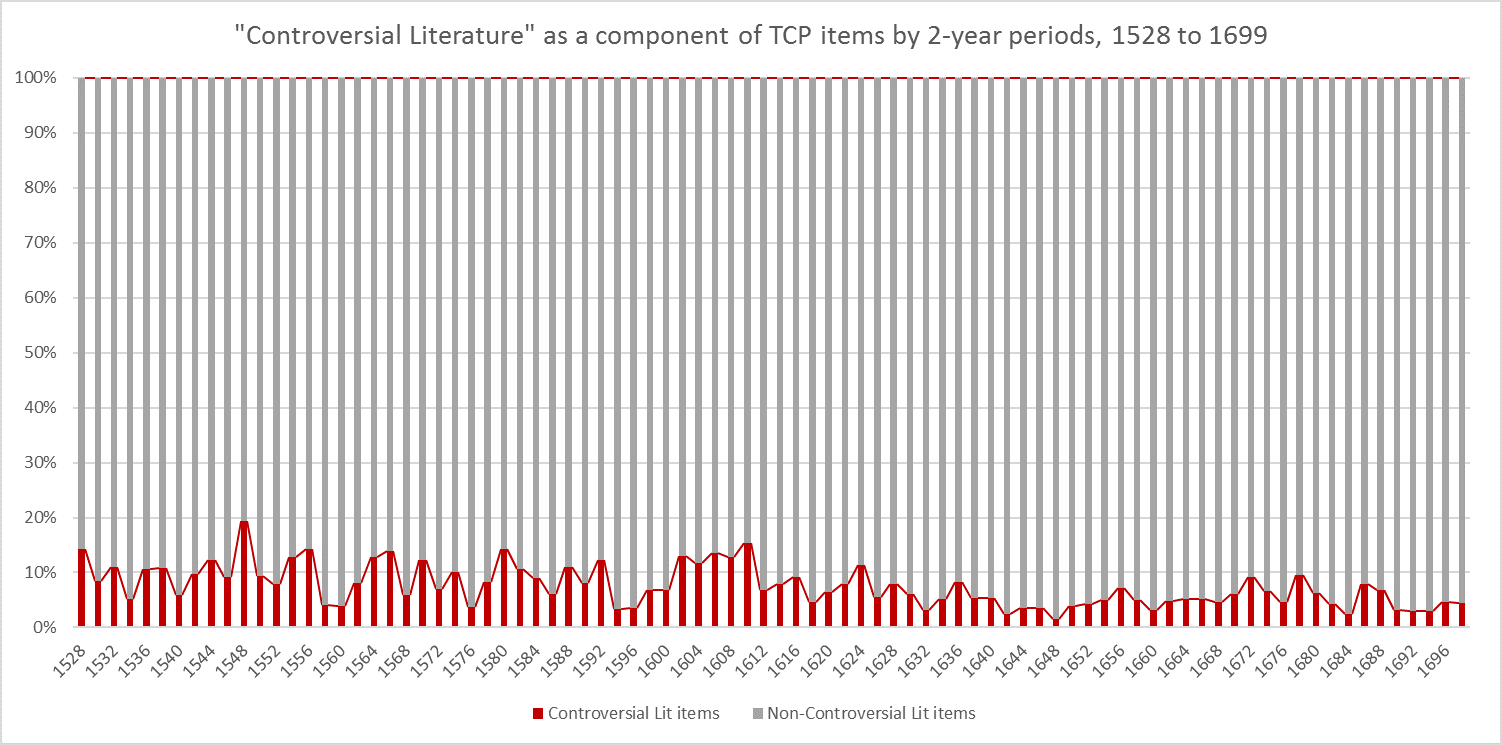
Finally, beginning in 1528-9 (when “Controversial Literature” becomes continuous) and ending in 1698-9 (to avoid a misleading dip caused by the relative absence of items in 1701), here is the distribution of Controversial literature as a component of TCP across the two-year periods.

“Controversial Literature” as a component of EEBO-TCP, 1528-1699: Each bar represents 100% of the EEBO-TCP items for the specified 2-year period.
In this view, we can see firstly that the peak occurs in 1548-9, but also that (due to the combination of a peak in items so-labelled and a relative dearth of items) in 1610-1611 so-termed “Controversial Literature” has an atypically high stake. Its 15.3% is the second highest point across the 172-year span.
The final table offers a snapshot from the data for comparison:

How raw values convert to percentages: “Controversial Literature” and other EEBO-TCP items for specified 2-year period(s).
And if all this leaves you wondering what constitutes “Controversial Literature” (and why it matters for us), that question will form the core of my next LDNA blogpost.
